Introduction
This is the second year of carrying out an analysis on the AQE raw scores, and for this to happen, parents need to request their scores from AQE directly, so a big thank you to all those who took the time to do this and gave us some statistics to analyse. The ultimate hope is to help and provide some guidance to the up-and-coming AQE candidates.
This page will cover the following sections, and each of these titles have hypertext links which you can jump to directly – if you’re that type of reader, or want to find a section second time around.
- Purpose of Research
- Limitations With The Data Submitted
- Variables And Assumptions
- Highest & Lowest Score (AQE 2018)
- Little Difference Despite 7-8 Months Younger
- What Percentage Do You Need To Get 100?
- Can I Use This Analysis To Make Judgement On Practice Test Scores?
- Paper 3 Average Lower in 2018
- You Can Bomb One – Don’t Worry!
- No Gender Significance
- A Big Thank You To All Involved
Purpose of Research

Every year, one of the most frequent questions that comes up in the very popular, Facebook Support Group, (you can join the group and it’s FREE to do so) is around how the scoring works and in particular, how the standardisation process works.
In my experience, for those with younger kids e.g. born in June, parents are excited to learn if their child will get extra marks, but for those with the older kids e.g. born in July, parents can panic that their child will be disadvantaged in some way. At this early stage, I can confirm that neither scenario will happen through standardised marking as there is no such thing as extra marks being awarded to younger candidates.
Another big question from parents, who are trying to gauge what score is ‘enough’ is to understand what percentage score would the child have to get to achieve a 100 result in AQE. This will also be attempted through this research.
Whilst, AQE has offered an insight into their scoring process (see here for more info – AQE Scoring Explained), it has still left a number of unanswered questions and this research was undertaken to try to break down some of those common, scoring questions and offer parents a clearer understanding of the correlation between the raw scores and the standardised ones.
Limitations With The Data Submitted

Before I start to delve into the whys and wherefores of what the raw data tells us, it’s important to understand that the biggest challenge we had in analysing the data was the lack of a a significant set of data.
In total, there were 418 useable data submissions (a huge improvement from last year’s when we only had 149 data sets) but whilst this is great (and it really is), when we put this into the context that 8,707 children sat the AQE test in 2018, you can understand that this is still a very, small percentage, and only 4.8% of total applications.
In addition to the sample being relatively small, it is understandable to appreciate that the parents who ‘played along’ (by requesting their raw score data) were the ones that were happy with their child’s result, whilst others were maybe quicker to put the whole experience behind them. This was evidenced in the fact that the average standardised score of the whole sample was 105 (last year it was 107, so this is a bit of an improvement) and only 109 results submissions had a standardised score of less than 100 (last year it was 24, so both around a quarter of the total amount).
Inevitably, a smaller data set and a skewed one (to the right), will ultimately impact on any statistical analysis – however, we’ll press on with those limitations clearly set out.
Variables And Assumptions

The final piece of housekeeping I have do, is point out the variables in any raw scores submission, along with the assumptions we made during the analysis.
For each child, their main variable would be the cohort they are placed into (which is essentially based on their age in days) and this has the added complexity that a child’s cohort may change as they become older and move into a different group.
In addition, the key assumption made is that the two highest raw scores were the ones used to contribute to the resulting, standardised score – however, this may not hold true if the average raw score of one paper was significantly lower than that of another, even if the child achieved a lower percentage raw score.
If we had a complete set of data, we could have worked out the average of each paper, but working within the limitations of our sample, assumptions had to be made to progress.
Highest & Lowest Score

Every child tries their best and that’s all we can ask of them and I think they’re all fabulous for simply trying. However, there’s always a curiosity around what the highest and lowest scores were. Therefore, to provide this insight, I can let you know that:
The highest score we saw was 130.
The lowest score we saw was 60.
Like any test with standardised scoring, it’s natural to have scores on the ‘tails’ (like the ones above) and this is the extreme ends of the scores. However, the way it works statistically, the majority of people will be around the average with a 90 – 100 score.
Little Difference Despite 7-8 Months Younger

A common myth among parents is that people who have a younger child will get extra marks, simply for being younger, but categorically, as outlined by the AQE scoring process, this is not the case.
However, it was also an hypothesis we wanted to explore with our data sample and we found that there was evidently no linear relationship relating to higher standardised scores for younger candidates with similar raw scores. That’s not to say that the age of a child, or rather, the cohort they find themselves in, could not have had some impact on their standardised score, but one cannot simply say that a younger child will benefit when it comes to their age.
To provide some statistical evidence to support this, the data table below shows three children who took the test in 2018. One was born in October ’07, one in May ’08 and the third in June ’08 – so the latter are effectively 7-8 months younger than the October child.
In this particular set, when we calculated the average of their best two papers, they are all seen to score around the 44.5 (raw score average) and in all three cases this translated to a 100 standardised score.
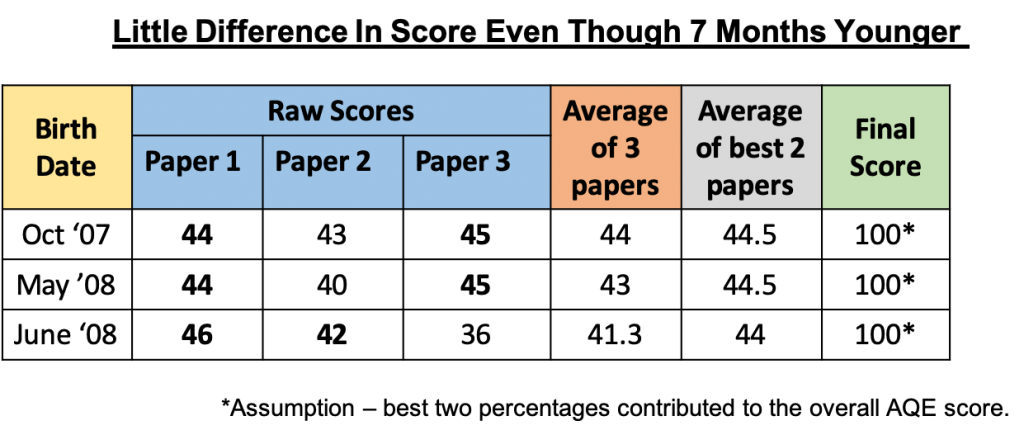
Assuming the best two scores are used to calculate this final score (and in these cases this looks very likely), then we can conclude that the average of all their cohorts must have been almost (if not) identical, as it didn’t cause any variation when the standardised scoring system was applied.
If there had been a statistical significance due to the age of candidates that scored the same raw score, one would’ve expected to see the AQE score to be greater for the younger children (in May or June), when compared to the child born in October the year before. As there was no difference in the overall end score, when the raw scores were compared (over the different ages), then, in this case, age did not offer any advantage or disadvantage.
This fact should offer some assurances to parents of children who are older and may have previously been concerned about being disadvantaged. But I this fact may also upset some parents of a young child who was maybe hoping for a few extra marks.
Been on both sides of this myself so I absolutely understand. 🙂
What Percentage Do You Need To Achieve To Get A Score Of 100 in AQE?
Well, isn’t this the golden nugget that everyone wants to know?
Knowing this level is important for a couple of reasons. Firstly, if your child achieves a score of 100 it means that they achieved the average of the cohort and secondly, this can be used as a good guide when you look at the scores that were taken by previous year’s schools in the Lowest Scores Accepted By Grammar Schools 2018-2014 blog – but of course this is only a gauge from the past and next year could be higher or lower.
This year there were 15 submissions that resulted in the final score of 100 (last year it was 5) and reviewing these we can see that it’s difficult to be precise exactly (due to the fact that we only have less than 5% of the results from the total amount of people who sat the test) but what we can conclude categorically is:
From the results of all the people who scored 100 in the AQE test in 2018, their raw score percentage was somewhere between 69% – 73%.
Last year, the results from the people who scored 100 in the AQE test in 2017, their raw score percentage was between 72%-73% – but you have to remember this was only based on a more limited sample.
Can I Use This Analysis To Make Judgement On Practice Test Scores?

*** IMPORTANT – PLEASE READ BELOW CAREFULLY ***
Ultimately, it’s important to embrace the fact you cannot tell from a test paper how your child will do in the final AQE test as this will be based on the average of the cohort – so trying to do this, in my experience, just causes stress and anxiety and not worth the effort. My advice – take each revision time or practice paper as a learning aid for continuous improvement and NO MORE.
For example, when a child does a practice paper in school or at home and they achieve, say, 70%, parents naturally start to wonder if this is going to get them into grammar school.
However, you cannot use this analysis to conclude that their 70% would’ve got them a score of 100, based on that fact that that’s what was needed last year, because:
- This was a different test and may have been harder or easier than the AQE ones.
- There is no cohort average to provide a baseline so you can make any conclusions.
- The AQE result takes into consideration the best two out of three papers, so one paper with one result, is not sufficient to try to make a comparison.
- The child may have been particular focused (or unfocused) that day, and so may actually do better (or worse) on the day. A practice test is just that – practice.
It’s like comparing apples to oranges, it’s not possible. Each test will be different. Each child will feel different on different days with different energy levels and excitement, so all you can do is support the learning as best as possible and not become too focused on their score each time.
Paper 3 Average Lower in 2018

With the wider picture that we have behind the scenes, it shows that Paper 3’s raw scores to be less across the board and therefore had a lower average. This was the same conclusion reached in the 2017 papers too.
To back this up with evidence, the table below shows the average of the three papers, with all the results from the 418 returns. Scores are out of 64.

This was interesting as I often witness many kids thinking, “That’s me, I’ve done two papers and that’s enough so I don’t need to try so hard for the third“, and even parents losing some momentum on the third paper, with a sense that they’ve reached the end and are a bit burnt out.
That’s not a judgement but merely an observation and with this information in your toolkit, it’s worth inspiring and injecting that extra special energy boost into Paper 3 because if a child scores 70% in all papers, if the average is lower in this paper and they have maintained their high performance in Paper 3 (and not dropped off), then they will yield a higher standardised score (if the average drops).
Alternatively, another reason for the drop may have been because the Paper 3 may simply have been much tougher in 2018 and so it’s showing a statistically lower average, simply due to the difficulty of the paper.
You Can Bomb One – Don’t Worry!

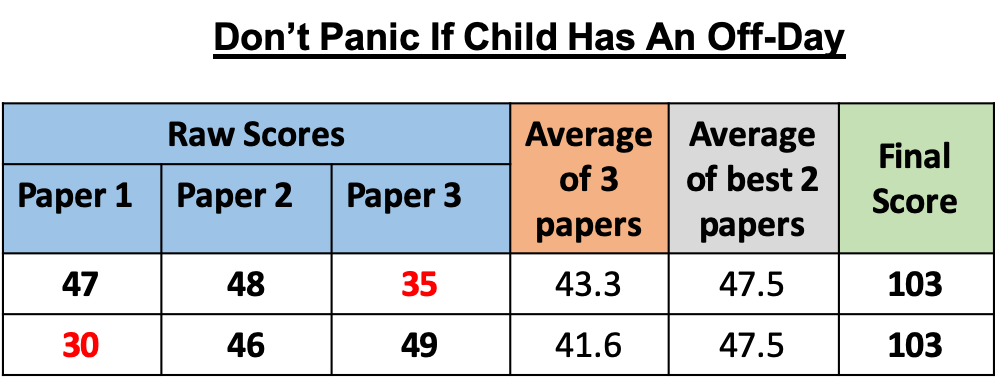
As you may know, the AQE result is based on the results from the best two papers.
From our analysis, this setup really did help some people last year as we saw there were indeed some kids who did significantly worse in one paper, but still pulled off a fantastic AQE score.
For example, the table below shows two, real candidates who scored well on two of their papers, but didn’t do so well with a 35 in Paper 3 and the other one had a 30 in Paper 1 – but overall they both achieved a super result of 103.
Now, obviously the intention is not to do badly in ANY paper, but this is meant as a reassuring message in case you do find your child coming out of a paper and not happy with their performance.
If this happens, just remember they have this buffer and explaining this science to them may help them if they’re upset or feel there is no hope.
No Gender Significance

Contrary to some people’s views, there are no extra marks awarded to boys due to late development, so just worth being clear on this this point.
A Big Thank You To All Involved

A huge thank you to each individual who took the time to request their marks and complete the submission form, as without each of you doing this, this initial research would not have been possible.
Also, this wasn’t work that I undertook myself but was very much part of a team of three people and for this I’m very grateful as it has helped me immensely in the time taken, and experience needed, to conduct the analysis – in particular, as a sounding board in exploring the assumptions, ideas, concepts and learning points for future candidates (or rather for their parents).
I do hope that this has helped you understand the complexity of this scoring system, it has dispelled some common myths and you now appreciate the danger of using percentages in practice papers to try to guess if the child will ‘pass’.
Each year our group grows bigger and stronger, so hopefully next year everyone will understand the importance of requesting their raw data and sending it in so we can determine some valuable guidance.
In the meantime, good luck to everyone and keep up the good work.
More About The Transfer Tutor App

The Transfer Tutor is an online site dedicated to providing fun and interactive quizzes aligned to the AQE / GL specifications. All quizzes are broken down into manageable topics and can be done on any mobile device, tablet or computer, so is an great way for kids to prepare for the test.
To give you a feel for the quizzes, start the quick quiz by clicking on the button below (don’t worry, you don’t have to give me your details or sign in) but it will let you see how it works.

There are a great range of licences for you to choose from, including a one-off cost and a monthly subscription, so check out the prices and options and I hope you’re pleasantly surprised.

Google Reviews For The Transfer Tutor

With a total of over 600 Five-Star Reviews in Facebook and Google – along with raving recommendations, it’s worth a look. Check out the Google Reviews here to read the detailed comments and then decide for yourself.
I trust you’ve enjoyed this blog, and feel free to drop me any questions about the App through Facebook or via email.
Thanks and good luck.