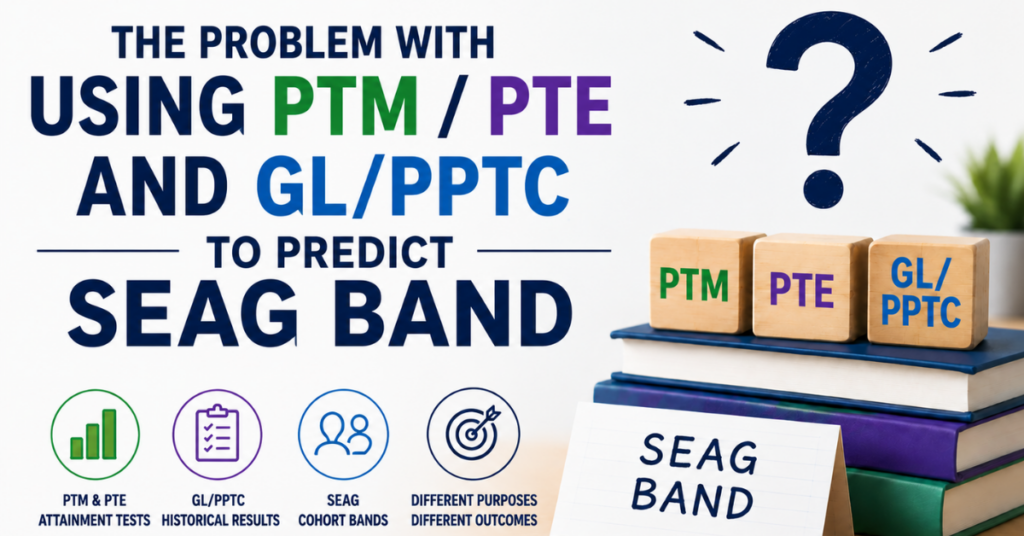
I am hearing rumblings about the notion that it is possible to assess a child’s academic ability by combining their PTM and PTE standardised scores to estimate a SEAG Band outcome, specifically using the historical GL/PPTC scale.
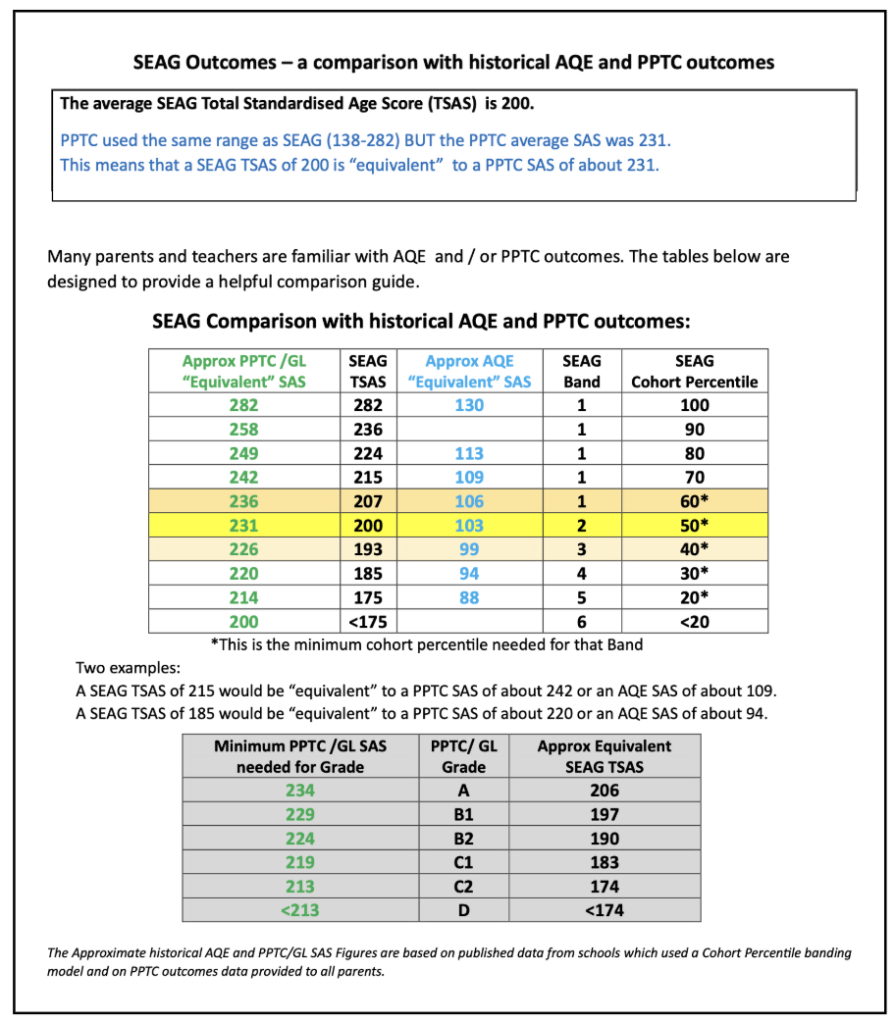
I can understand how this logic may appear straightforward because SEAG has published historical comparison data (see image below) linking old GL/PPTC scores to modern SEAG Bands, but this was just to offer some comparative context and they were never meant to be used in this way.
More importantly, there is a fundamental statistical problem with this approach as PTM and PTE scores were never designed to behave like historical GL/PPTC entrance assessment scores and direct comparisons can produce misleading outcomes, particularly around average attainment levels.
Although all of these assessments indicate they use standardised scores, the scales and distributions behind them are very different.
For example, a pupil scoring 100 in PTM and 100 in PTE has achieved average attainment in both assessments. However, when these scores are simply added together, the combined total of 200 would align roughly with a SEAG Band 6 prediction using the historical GL/PPTC comparison tables which would be in the bottom 20% of all participants. That doesn’t make sense.
This immediately raises questions because average attainment and bottom-band selective performance are not equivalent concepts.
Different Population Numbers and Stated Means
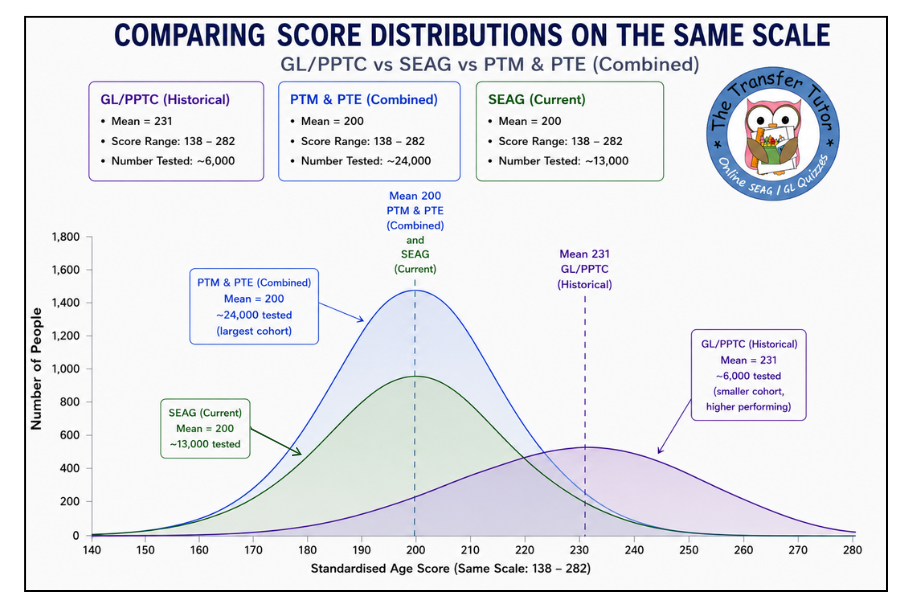
The key issue lies in the averages behind the different assessments.
PTM and PTE standardised scores are both built around a mean average of 100.
SEAG outcomes are also centred around a mean average, with the average Total Standardised Age Score being 200.
This means:
- PTM and PTE are measuring pupils against a standardised average population
- SEAG Bands are built around the performance of the SEAG cohort itself
Historical GL/PPTC scores worked very differently.
According to the published comparison information from SEAG, the average GL/PPTC Standardised Age Score was approximately 231, despite using a similar numerical range to SEAG.
This is where the comparison becomes problematic.
When schools combine:
- PTM 100
- PTE 100
they arrive at a total score of 200.
Yet:
- 100 in PTM represents average attainment
- 100 in PTE represents average attainment
whereas:
- 200 in historical GL/PPTC terms sat well below the average transfer score of approximately 231 and and would align roughly with a SEAG Band 6 comparison.
The issue becomes even more striking when slightly above-average scores are considered.
For example, a child achieving:
- PTM 106
- PTE 107
has performed above average in both assessments.
However the combined score of 213 would still sit below the historical GL/PPTC average and could still fall into an approximate Band 6 comparison using the published conversion tables.
This highlights the central problem – although the numbers may look similar on paper, they are not centred around the same averages and are therefore not measuring performance in the same way.
This means that directly comparing combined PTM/PTE totals with historical GL/PPTC scores risks treating two fundamentally different statistical models as though they are equivalent.
Statistical Logic – How The GL / PTTC Mean (Average) Can Be 231
For all tests, if a score is genuinely standardised with:
- mean 100 for each paper
then:
- the combined mean (for maths and English) should mathematically centre around 200.
This cannot even be explained by suggesting the cohort was more academically able, as a highly academic year might simply tighten the spread but it would never move the published mean all the way to 231 if the scores were being conventionally standardised around the sitting cohort.
I do recall reading about GL Scoring and GL explaining they used a sample to test the questions difficulty level etc. and it is my understanding that this is why they don’t release their questions as they are reused mainly down to the fact that a lot of work has been put into the psychometric testing. I am happy to be corrected if anyone has a deeper understanding of the exact processes used but the only logical explanation I can conclude is that GL/PTTC have:
- used predetermined scaling
- calibrated score conversions
- and psychometric weighting models potentially including norm referencing, question calibration and statistical scaling
This approach appears to have been used to assign scores onto a reporting scale whose midpoint should be 200, but when applied to the NI cohort the 50% percentile and mid-point came out much higher at 231.
This is also born out to be true as the GL/PTTC equivalent score around the 50% cohort percentile is 231.
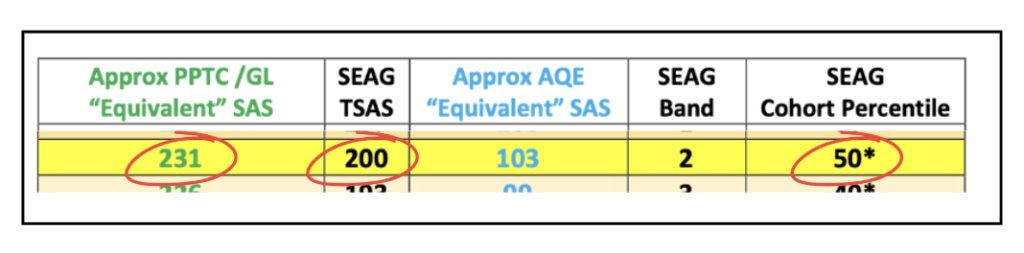
Having worked through the evidence, the only plausible explanation and probably the most statistically coherent one is essentially this:
- GL created and calibrated the assessment using its own national standardisation sample
- Within that reference sample:
- each paper was standardised to a mean of 100
- The same scoring conversion was then applied unchanged to the Northern Ireland transfer cohort
- The NI cohort performed significantly above the original national reference sample
- As a result, the observed NI cohort average rose to around 231
That would make perfect psychometric sense.
In other words:
- the scores were not re-standardised around the Northern Ireland cohort itself
- they were benchmarked against GL’s original calibration population
That would explain:
- why the published range still looked like a standardised scale 138-282
- why each paper theoretically had a mean of 100
- but why the actual Northern Ireland averages ended up much higher at 231
- And importantly – why the PTM/PTE scores cannot be used to determine the SEAG Band
Other Issues Using PTM & PTE To Predict SEAG Band
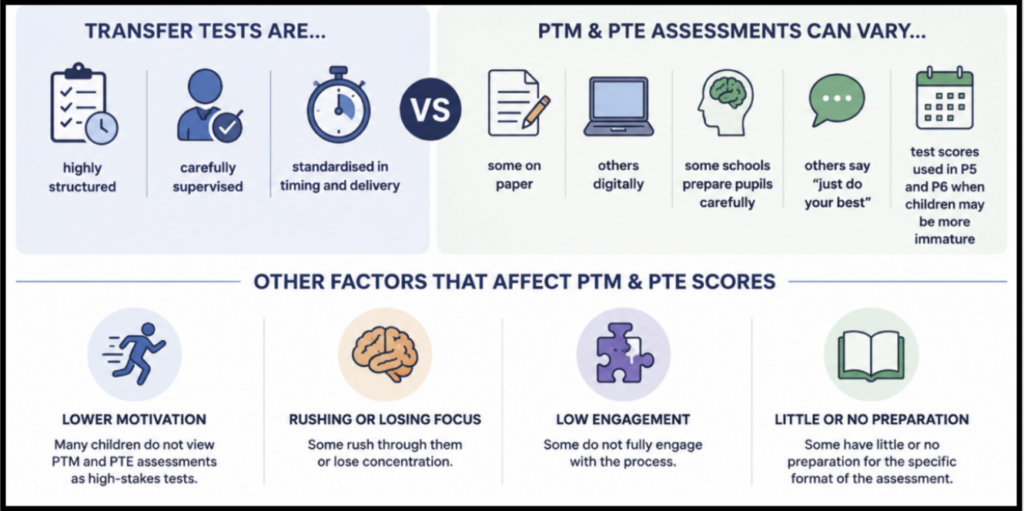
Another difficulty when using PTM and PTE scores to estimate SEAG outcomes is that the assessments are not always completed under consistent conditions.
Unlike transfer tests, which are:
- highly structured
- carefully supervised
- standardised in timing and delivery
PTM and PTE assessments can vary significantly between schools and even between classrooms.
For example:
- some pupils complete them on paper
- others complete them digitally
- some schools prepare pupils carefully beforehand
- others present them with little explanation beyond “just do your best”
- the test scores being used are carried out in P5 and P6 when the child could be significantly more immature
Motivation can also vary considerably.
Many children do not view PTM and PTE assessments as high-stakes tests in the same way they view transfer examinations and as a result:
- some rush through them
- some lose concentration
- some do not fully engage with the process
- and some experience little or no preparation for the specific format of the assessment.
PTM & PTE Sits Closer (Statistically) to SEAG TSAS
If you are looking for a quick conversion, one could reasonably argue that if PTM and PTE scores were ever to be used as part of a rough SEAG comparison, it would make more statistical sense to compare them directly with SEAG TSAS rather than converting them through the historical GL/PPTC scale.
This is because:
- PTM and PTE standardised scores are each centred around a mean average of 100
- SEAG English and Maths SAS are also centred around a mean average of 100
Therefore:
- PTM 100 + PTE 100 = 200
which aligns numerically with the average SEAG score.
By contrast, the historical GL/PPTC average sat much higher at approximately 231.
This means that converting combined PTM/PTE scores through the old GL/PPTC comparison tables introduces an additional statistical mismatch because the averages are no longer aligned.
This is just my take on the statistics for PTM/PTE, SEAG and GL/PTTC and in the absence of detailed GL/PTTC scoring explanations (not for the want of trying over the years), I acknowledge some thoughtful assumptions have been made. However if anyone has any evidence which supports or challenges this understanding, feel free to get in contact with me directly and I will adjust accordingly if necessary.

More about The Transfer Tutor (Multi-Award Winning Online Quizzes)

The Transfer Tutor’s Online Quizzes provide a fun and interactive way to learn and practise Maths and English questions which are directly aligned to the new SEAG (replacing AQE and GL) specification.
There are many, great features including (but not limited to):
- Quizzes broken down into specific English and Maths topics, to allow for focused learning and the ability to hone in on areas of weakness.
- Mobile friendly and works on any internet device.
- ‘Hint’ option supports the child’s learning. For example, in question about calculating area of an irregular shape, the hint will say, “Break it into two” – enough to keep the child going but teaching them for future, similar questions.
- The Leaderboard at the end makes the child feel like they’re playing a game and having friendly competition.
- Good use of colour and graphics which makes it exciting.
- Parents receives a progress email at the end to let them know how their child did.
Google Reviews

Check out the Google Reviews to read what other customers felt about The Transfer Tutor.
How To Buy
Simply choose the licence you need depending on the length of time you need access, click on the blue box below (Explore & Compare Licences), pay and then you’ll be off within minutes.
For any further questions, please contact me or check out the Frequently Asked Questions page.
All of these are a one-off payment until they expire – so no additional costs.

Try It Out:

To give you a feel for the quizzes, why not try out the quick fire free quiz by clicking on the button below (no need to register or pay, so don’t worry). This will hopefully let you see how the questions work – or more importantly, let you see if this is something that would inspire and encourage your child to learn.

Social Media Links – Keeping Up To Date

Follow or like The Transfer Tutor on your social media channel of choice and ensure you never miss a beat with the whole transfer process, handy tips, advice, special offers and competitions.
Click below for your preferred channel or search for @TransferTutorHQ wherever you are.
Free Facebook Group

You may have read in the reviews about people referring to the Facebook Support Group and this is certainly a great place to keep informed, ask questions, get support and keep up-to-date with anything happening in the transfer space.
It’s free to join but please ensure you have a genuine Facebook profile picture (ghost pictures are not approved as not deemed authentic) and then simply click here and answer the simple questions -> Join Facebook Group.